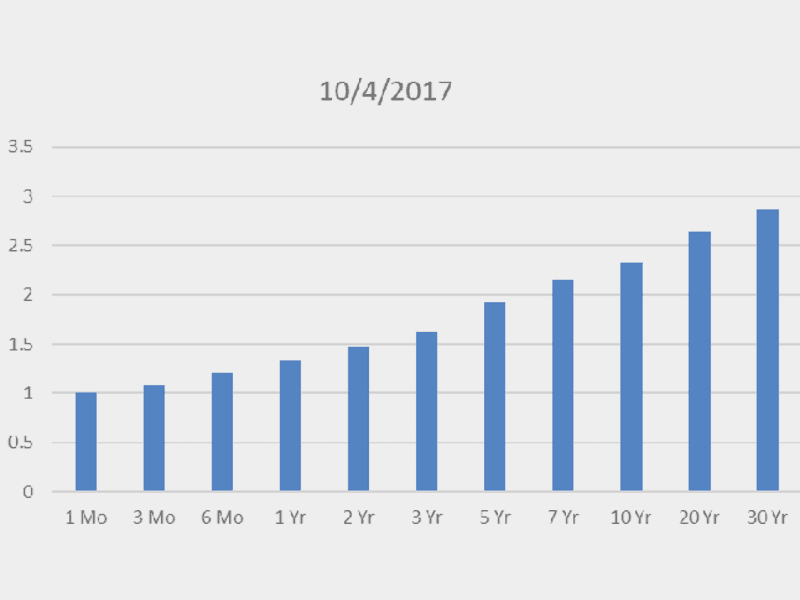
Yield Curve as of October 4, 2017
Y Axis = Interest Rates
X Axis = Duration or Maturity
At Creekside Partners we think one of the most impactful and telling market indicators is the US Treasury market yield curve. First, what does the current US treasury curve look like? As of October 4th we can see the yield curve below which is not particularly foreboding, but worth watching. If short term rates continue to rise and long term rates stay low then we could see an inverted yield curve which is extremely bearish. We constantly monitor this indicator because of its past success of predicting a contracting US economy.
Bottom-line, As of the beginning of the 4th quarter 2017, the yield curve is not indicating for us to make any significant portfolio changes. We will continue to monitor your asset allocation closely and make appropriate recommendations.
Creekside obtained the information from www.treasury.gov and www.investopedia.com
Primer on Interest Rate Yield Curve | What is a ‘Yield Curve’
A yield curve is a line that plots the interest rates, at a set point in time, of bonds having equal credit quality but differing maturity dates. The most frequently reported yield curve compares the three-month, two-year, five-year and 30-year U.S. Treasury debt. This yield curve is used as a benchmark for other debt in the market, such as mortgage rates or bank lending rates, and it is also used to predict changes in economic output and growth.
Breaking Down the ‘Yield Curve’
The shape of the yield curve gives an idea of future interest rate changes and economic activity. There are three main types of yield curve shapes: normal, inverted and flat (or humped). A normal yield curve is one in which longer maturity bonds have a higher yield compared to shorter-term bonds due to the risks associated with time. An inverted yield curve is one in which the shorter-term yields are higher than the longer-term yields, which can be a sign of upcoming recession. In a flat or humped yield curve, the shorter- and longer-term yields are very close to each other, which is also a predictor of an economic transition.
Normal Yield Curve
A normal or up-sloped yield curve indicates yields on longer-term bonds may continue to rise, responding to periods of economic expansion. When investors expect longer-maturity bond yields to become even higher in the future, many would temporarily park their funds in shorter-term securities in hopes of purchasing longer-term bonds later for higher yields. In a rising interest rate environment, it is risky to have investments tied up in longer-term bonds when their value has yet to decline as a result of higher yields over time. The increasing temporary demand for shorter-term securities pushes their yields even lower, setting in motion a steeper up-sloped normal yield curve.
Inverted Yield Curve
An inverted or down-sloped yield curve suggests yields on longer-term bonds may continue to fall, corresponding to periods of economic recession. When investors expect longer-maturity bond yields to become even lower in the future, many would purchase longer-maturity bonds to lock in yields before they decrease further. The increasing onset of demand for longer-maturity bonds and the lack of demand for shorter-term securities lead to higher prices but lower yields on longer-maturity bonds, and lower prices but higher yields on shorter-term securities, further inverting a down-sloped yield curve.
Flat Yield Curve
A flat yield curve may arise from normal or inverted yield curve, depending on changing economic conditions. When the economy is transitioning from expansion to slower development and even recession, yields on longer-maturity bonds tend to fall and yields on shorter-term securities likely rise, inverting a normal yield curve into a flat yield curve. When the economy is transitioning from recession to recovery and potentially expansion, yields on longer-maturity bonds are set to rise and yields on shorter-maturity securities are sure to fall, tilting an inverted yield curve toward a flat yield curve.

